Intel Advisor
Introduction
This tutorial will guide you how to run advisor in AMD processors, we explore also the type of code we can profile.
Project setup
First of all we are going to prepare an executable to run the test, we can copy the nqueens example from advisor installation directory:
cp /dcsrsoft/spack/external/intel/2021.2/advisor/2021.2.0/samples/en/C++/nqueens_Advisor.tgz .
we extract the contents and then we compile the serial version:
make 1_nqueens_serial
Then we create a project using advisor gui:
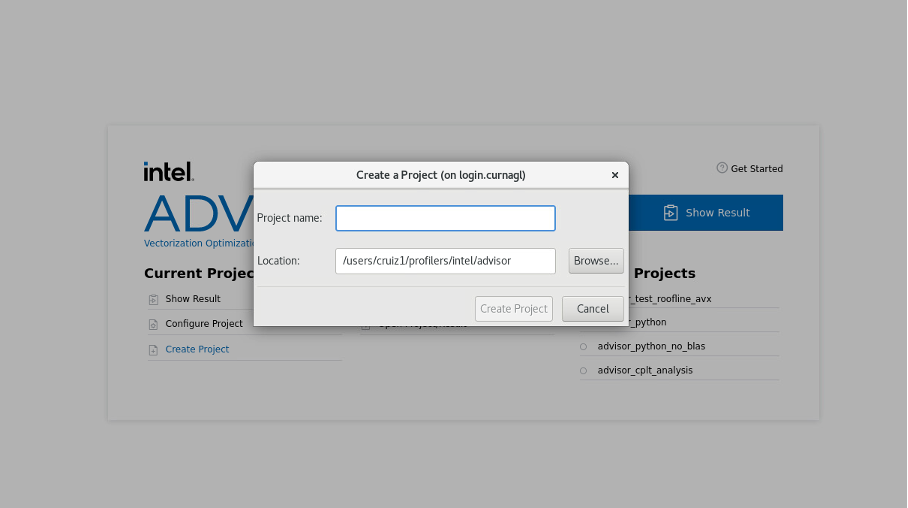
We configure the path of our nqueens executable (or the executable you want to profile), and we click on OK.
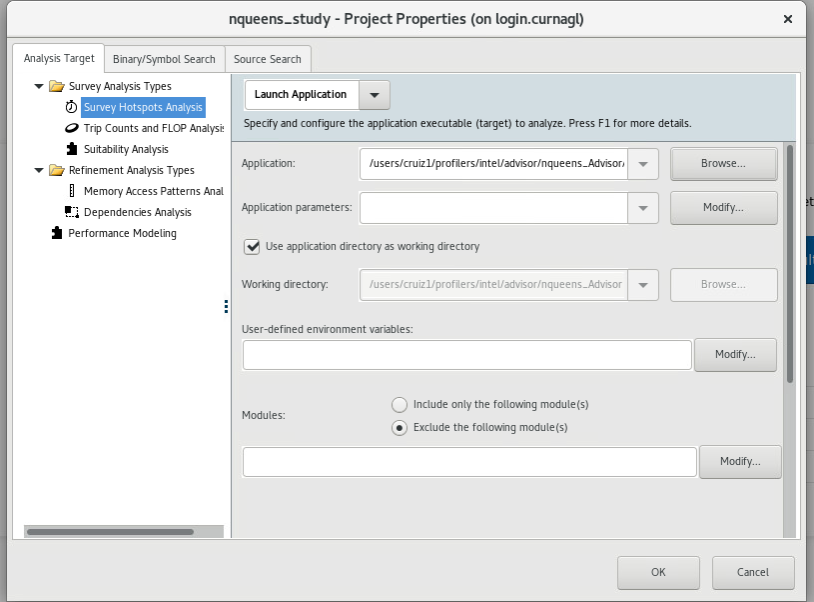
Several analysis are proposed:

We start with Vectorization and Code insights which will give us information about the parallelization opportunities in the code. it Will identify loops that will benefit most from vector parallelism, discover performance issues, etc, the summery window will give us more details.
USINGUsing SLURM
For using Advisor in the cluster it is better to use the command line. The GUI can give the commands to run. Let’s run the survey, to see the command to run, click on the following button


This will show the exact command to use:
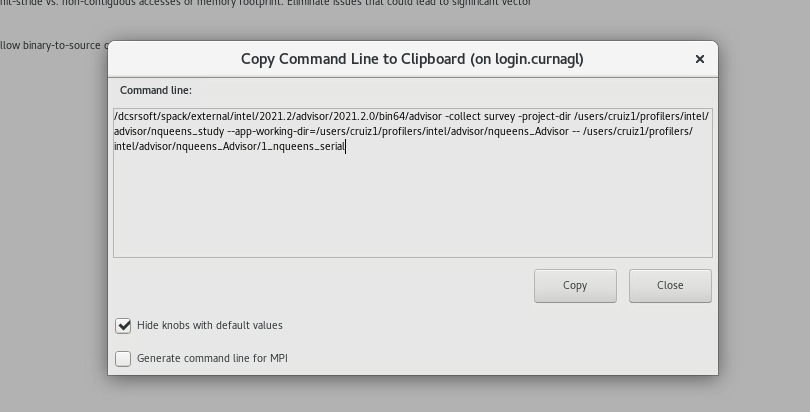
We can copy that line in our slurm job:
#!/bin/sh
#SBATCH --job-name test-prof
#SBATCH --error advisor-%j.error
#SBATCH --output advisor-%j.out
#SBATCH -N 1
#SBATCH --cpus-per-task 1
#SBATCH --partition cpu
#SBATCH --time 1:00:00

dcsrsoft/spack/external/intel/2021.2/advisor/2021.2.0/bin64/advisor -collect survey -project-dir /users/cruiz1/profilers/intel/advisor/nqueens_study --app-working-dir=/users/cruiz1/profilers/intel/advisor/nqueens_Advisor -- /use\
rs/cruiz1/profilers/intel/advisor/nqueens_Advisor/1_nqueens_serial
we launch the job:
sbatch slurm_advisor.sh
check for errors in Slurm output files.
Checking results
If we close and reopen the project we see that we have some results.
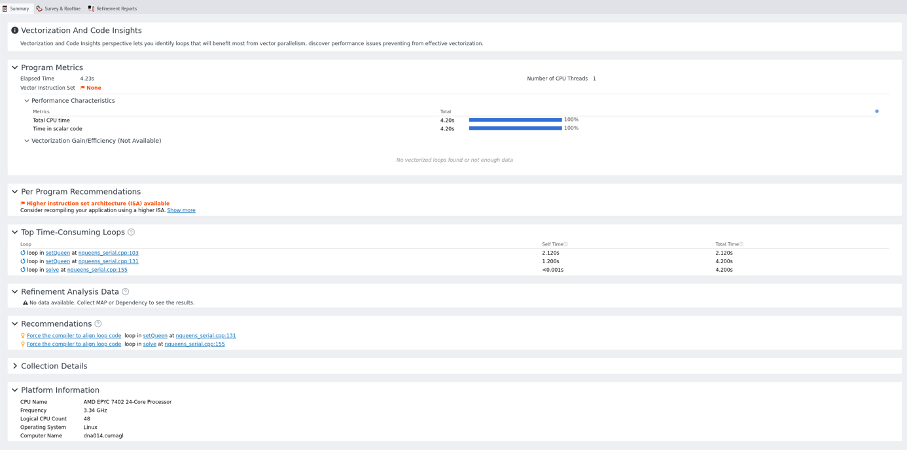
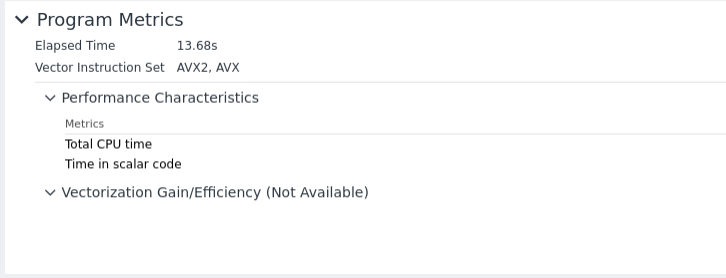
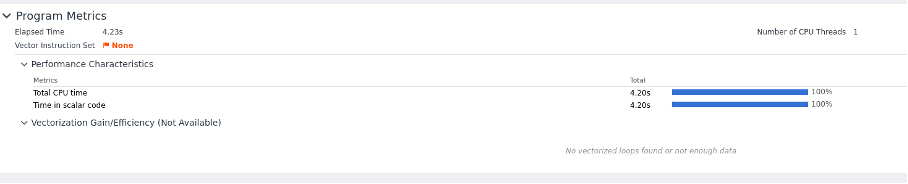
We have recommendations for using other instruction sets because no vector instruction set was detected.

We see the moremost time consuming loops:
It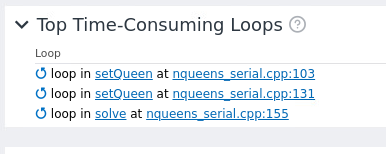
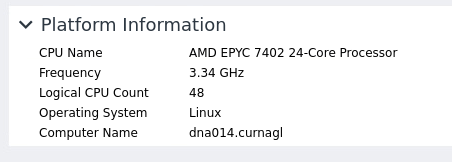
it detects correctly the CPU
In the survey window we have more details about the call stack:
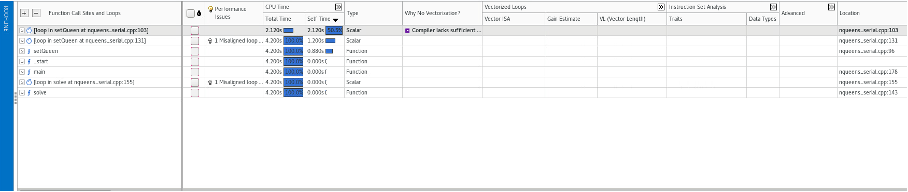 In this window we should see recommendation about the vector instructions to use, this is missing probably due to the fact that we are using an AMD
 processor.processors.
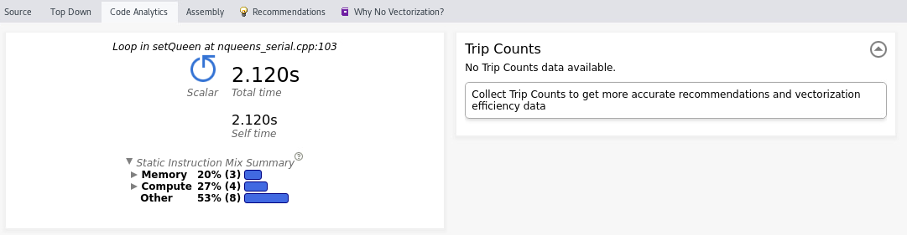
If we explore the windows at the botoombottom we see more information, as source code, top down, code analysis.analysis, etc. We see that we should collect first the trip count information.
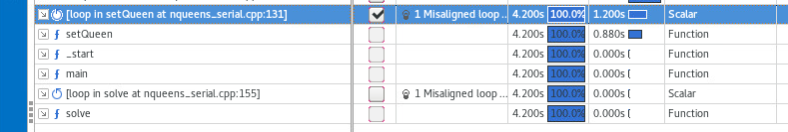
So we go to characterization, to improve analysis we should choose a loop, this can be done in the survey window:
 And then lanch the charatecrisitation, again we ask for the cmd line :
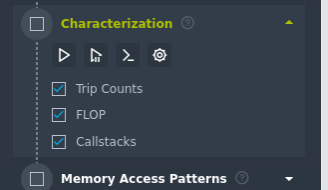
The generated command will contain the options:
Tripcounts -flop -stacks -mark-up-list-2
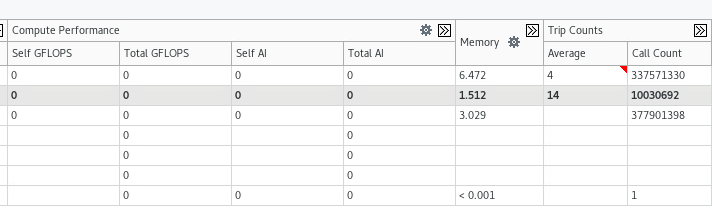
We can see the different trip counts for each loop:
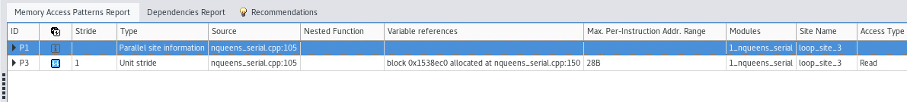
We can now repeat the process for memory access analysis
After running the analysis, we have new information:
 If we compile the code with more performant instruction set, this is detected in the summary window: