Intel Advisor
Introduction
This tutorial will guide you how to run advisor in AMD processors, we explore also the type of code we can profile.
Project setup
First of all we are going to prepare an executable to run the test,test. You can use any code to run this examples, here we canuse copyfor the first tests a the nqueens example from provided by advisor installation. So, we copy it from advisor installation directory:
cp /dcsrsoft/spack/external/intel/2021.2/advisor/2021.2.0/samples/en/C++/nqueens_Advisor.tgz .
we extract the contents and then we compile the serial version:
make 1_nqueens_serial
Creating a project
Then weWe create a project using advisor gui:
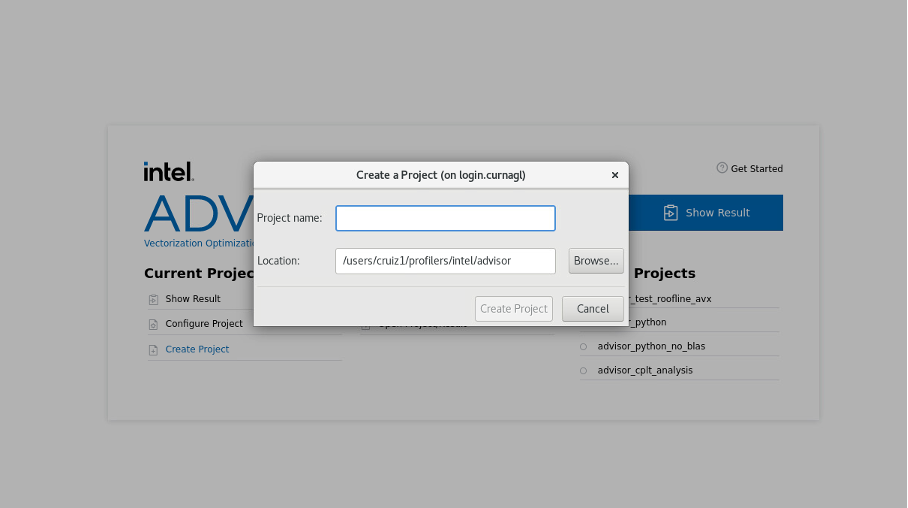
We configure the path of our nqueens executable (or the executable you want to profile), and we click on OK.
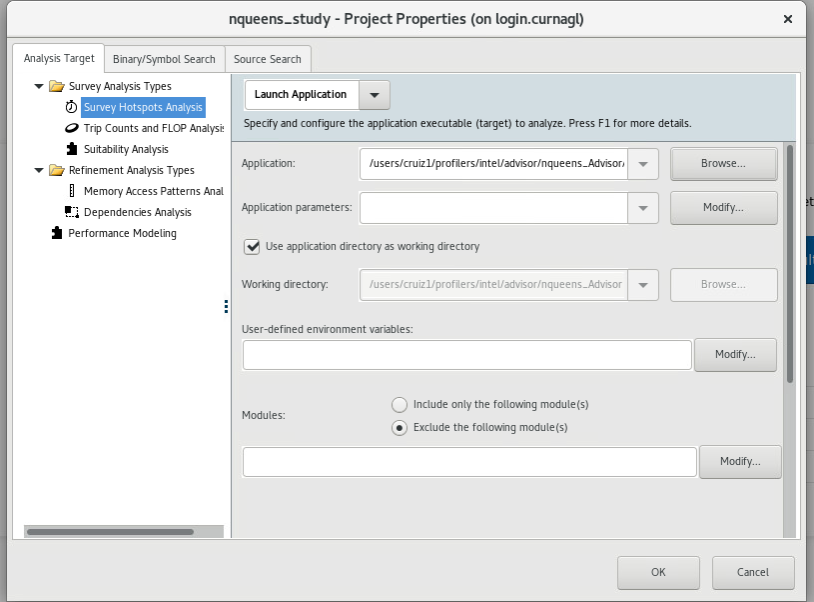
Several analysis are proposed:

We start with Vectorization and Code insights which will give us information about the parallelization opportunities in the code. It Willwill identify loops that will benefit most from vector parallelism, discover performance issues, etc, the summary window will give us more details.
Using SLURM
For using Advisor in the cluster, it is better to use the command line. The GUI can provide the commands to run. Let’s run the survey, to see the command to run, click on the following button


This will show the exact command to use:
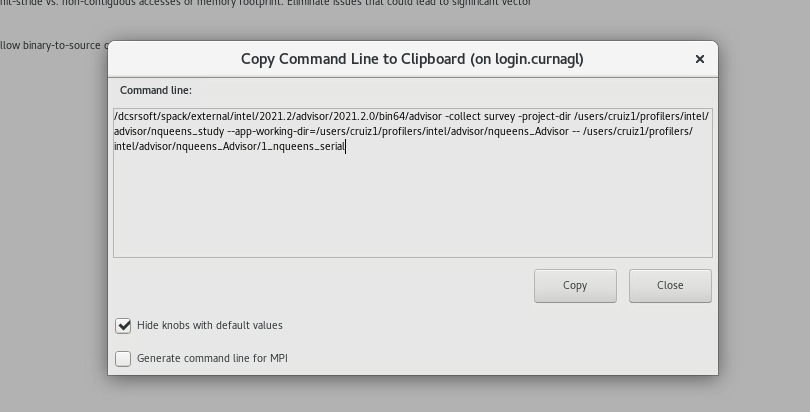
We can copy that line in our slurm job:
#!/bin/sh
#SBATCH --job-name test-prof
#SBATCH --error advisor-%j.error
#SBATCH --output advisor-%j.out
#SBATCH -N 1
#SBATCH --cpus-per-task 1
#SBATCH --partition cpu
#SBATCH --time 1:00:00

dcsrsoft/spack/external/intel/2021.2/advisor/2021.2.0/bin64/advisor -collect survey -project-dir /users/cruiz1/profilers/intel/advisor/nqueens_study --app-working-dir=/users/cruiz1/profilers/intel/advisor/nqueens_Advisor -- /use\
rs/cruiz1/profilers/intel/advisor/nqueens_Advisor/1_nqueens_serial
we launch the job:
sbatch slurm_advisor.sh
check for errors in Slurm output files.
Checking results
If we close and reopen the project, we see that we have some results:
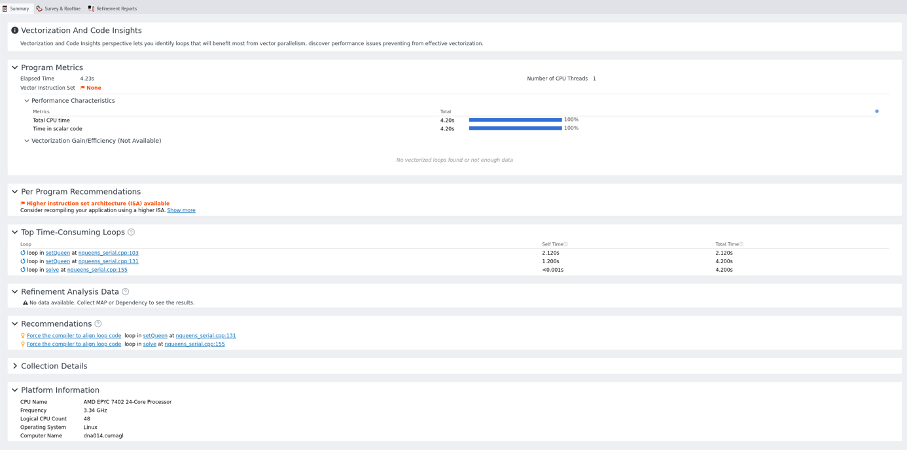
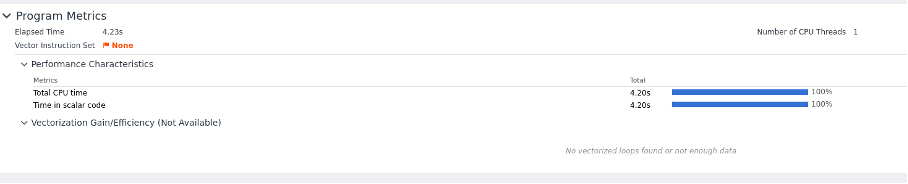
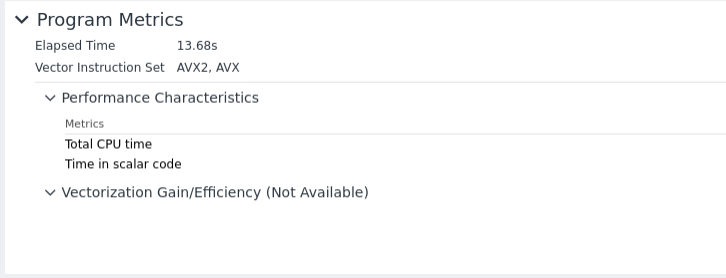
We have recommendations for using other instruction sets because no vector instruction set was detected.

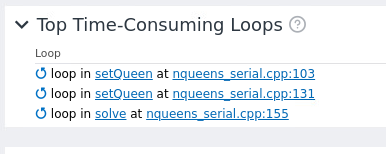
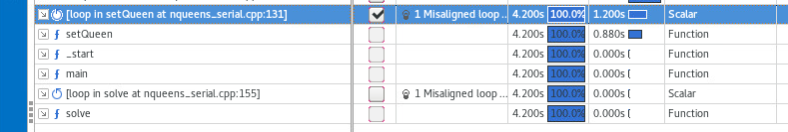
We see the most time consuming loops:
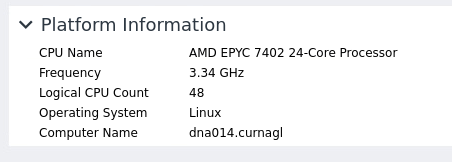
It detects correctly the CPU
In the survey window we have more details about the call stack:
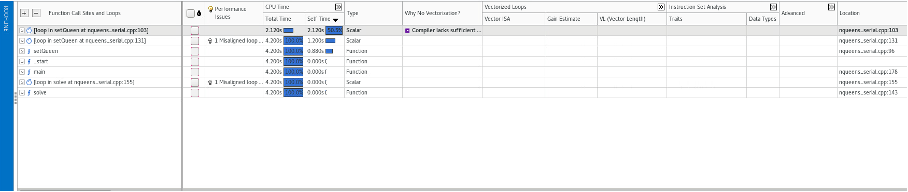 On the window above we should see recommendation about the vector instructions to use. This is missing probably due to the fact that we are using an AMD processors. Compilation of code using Intel did not help.
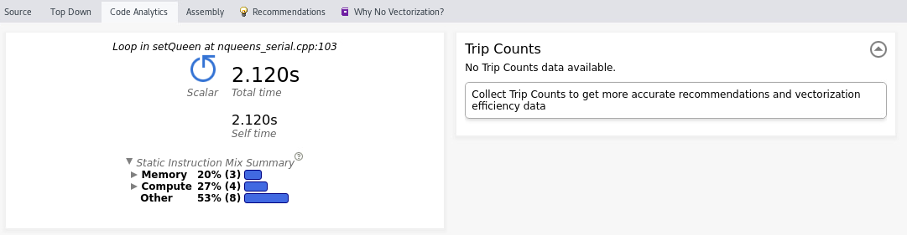
If we explore the windows at the bottom we see more information, as source code, top down, code analysis, etc. We see that we should collect first the trip count information.
Collecting trip counts
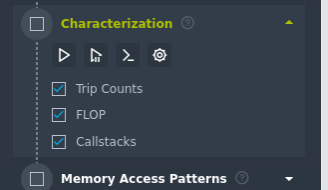
So we go to characterization. To improve analysis we should choose a loop, this can be done on the survey window:
 And then launch the characterizitation, again we ask for the cmd line :
The generated command will contain the additional options:
tripcounts -flop -stacks -mark-up-list-2
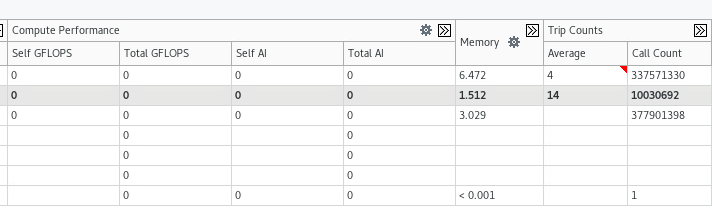
We can see the different trip counts for each loop:
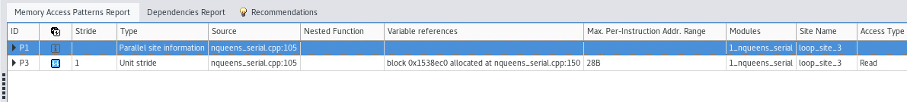
We can now repeat the process for memory access analysis. After running the analysis, we have new information:
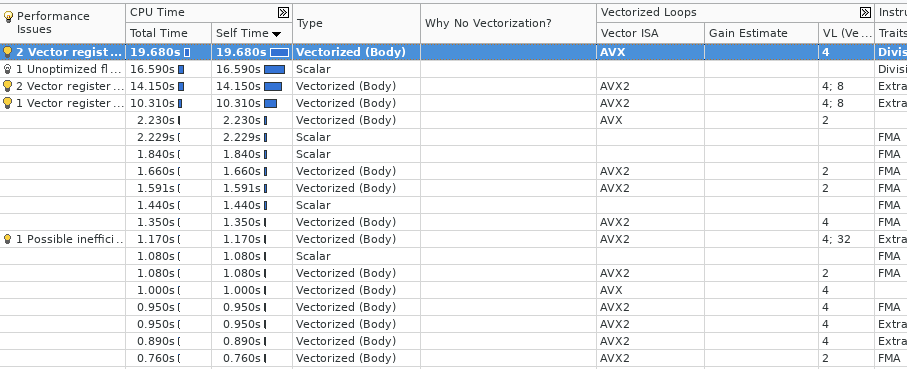
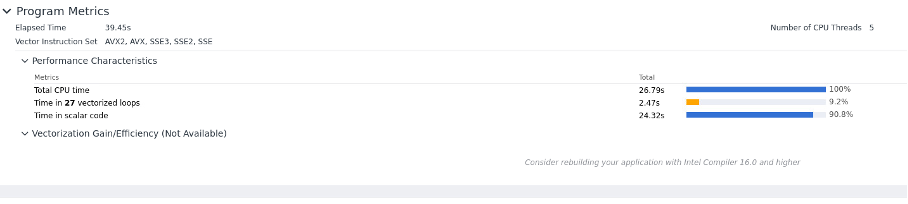
 If we compile the code with more performant instruction set, this is detected in the summary window:
and the call stack window:
This screenshoot was obtained profiling HPL Benchmark.
MPI profiling
The command proposed by the GUI is not the appropriate, we should use the following command:
srun advisor --collect survey --trace-mpi -project-dir /users/cruiz1/profilers/intel/advisor/analysis_mpi_trace-2 --app-working-dir=/users/cruiz1/profilers/intel/advisor/mpi_sample -- /users/cruiz1/profilers/intel/advisor/mpi_sample/mpi_sample_serialThe default behavior generates a profile database per rank which is not ideal to understand the interactions between MPI ranks. We can use the option --mpi-trace but unfortunately this seemsdoes not seem to not give more additional information as it only works if we use the same host.
One possible approach is to only profile one processes using SLURM multiprogram option:
srun --multi-prog task.conf
the task.conf would look like:
0 /dcsrsoft/spack/external/intel/2021.2/advisor/2021.2.0/bin64/advisor -collect survey -project-dir $PROJECT_DIR  -- $PATH_BINARY/xhpl

1-3 ./xhpl
In this example, we profile the rank 0.
Python application
It is possible to profile python application. For example to profile a tensorflow code:
advisor -collect survey -project-dir /users/cruiz1/profilers/intel/advisor/tensor_flow_study -- python /users/cruiz1/python/run_test.pyWe have the following summary:
We can see that the code uses vector instruction (In this example the CPU version of Tensorflow was used).
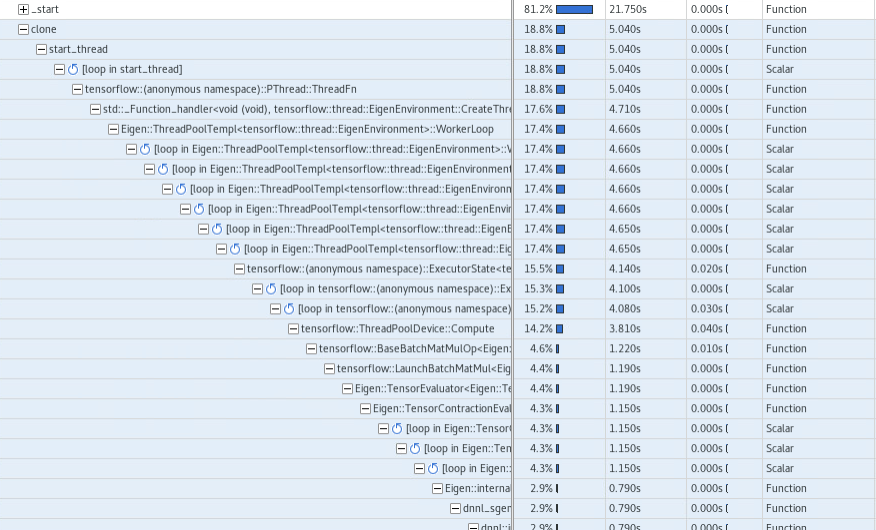
The complete call tree shows:
Additionally, we can create a roofline model:
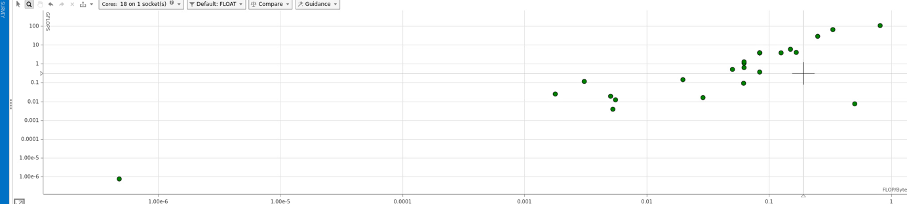
For the moment I’m not able to get the roofline model to work as it run it with the GUI interface.